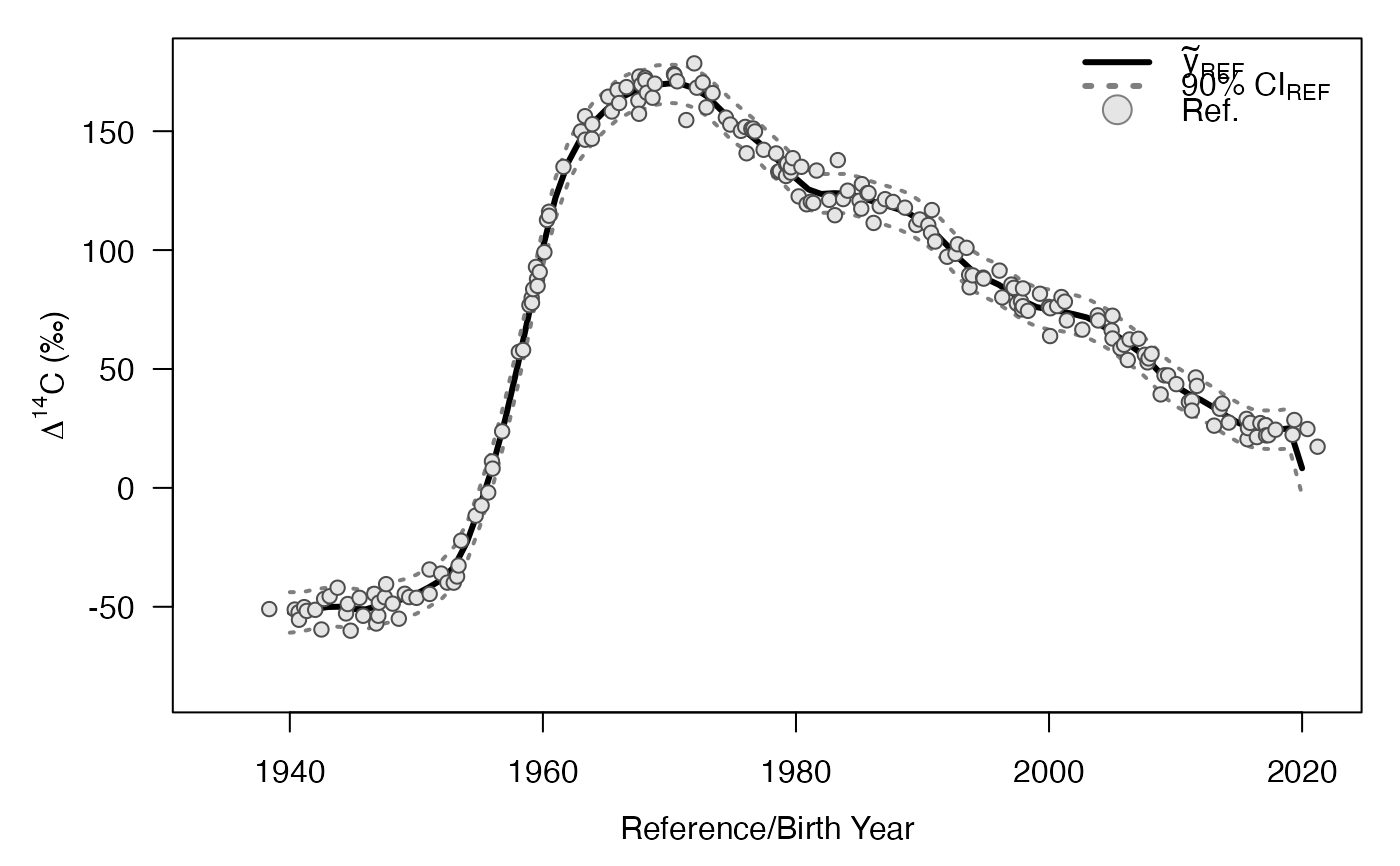
Plotting Bayesian B-spline model
plot_fit.Rdfunction for plotting Bayesian B-spline model for estimating reference series and/or assessing aging bias
Arguments
- df
data list object from
data_prepand used to estimate the STAN model- ext
posterior draws extraction list from
extract_drawsfunction- probs
vector of three probabilities for lower CI, centrality, upper CI
- post.den
logical flag to plot posterior densities of certain parameters
- legend
logical flag to plot legend
- inset.control
a list with values of width (width of the inset posterior in proportions of xlim), height (height of the inset posterior in proportions of ylim), sig_low (lower position of sigma posterior in proportions of ylim), adj_low (lower position of BY_adj posterior in proportions of ylim), xbump (translation of posteriors along x-axis in proportions of xlim).
- plot_bias
logical flag whether to plot the formation year adjustment (only for models with test samples)
- legend.lab
labels for the reference and test observations
Examples
#REFERENCE-ONLY
df <- data_prep(sim_ref)
#> [1] "B-spline model indicated, adding additional data values for spline control"
#> No values provided in df_unk, skipping validation and estimating reference series only

#estimate model
fit <- est_model(df, show_messages = FALSE, show_exceptions = FALSE)

#extract draws
draws <- extract_draws(fit)

#plot fit
plot_fit(df, draws)


#INTEGRATED
if (FALSE) { # \dontrun{
df_int <- data_prep(sim_ref, sim_unk)
fit_int <- est_model(df_int)
draws_int <- extract_draws(fit_int)
plot_fit(df_int, draws_int)
} # }
#INTEGRATED
if (FALSE) { # \dontrun{
df_int <- data_prep(sim_ref, sim_unk)
fit_int <- est_model(df_int)
draws_int <- extract_draws(fit_int)
plot_fit(df_int, draws_int)
} # }