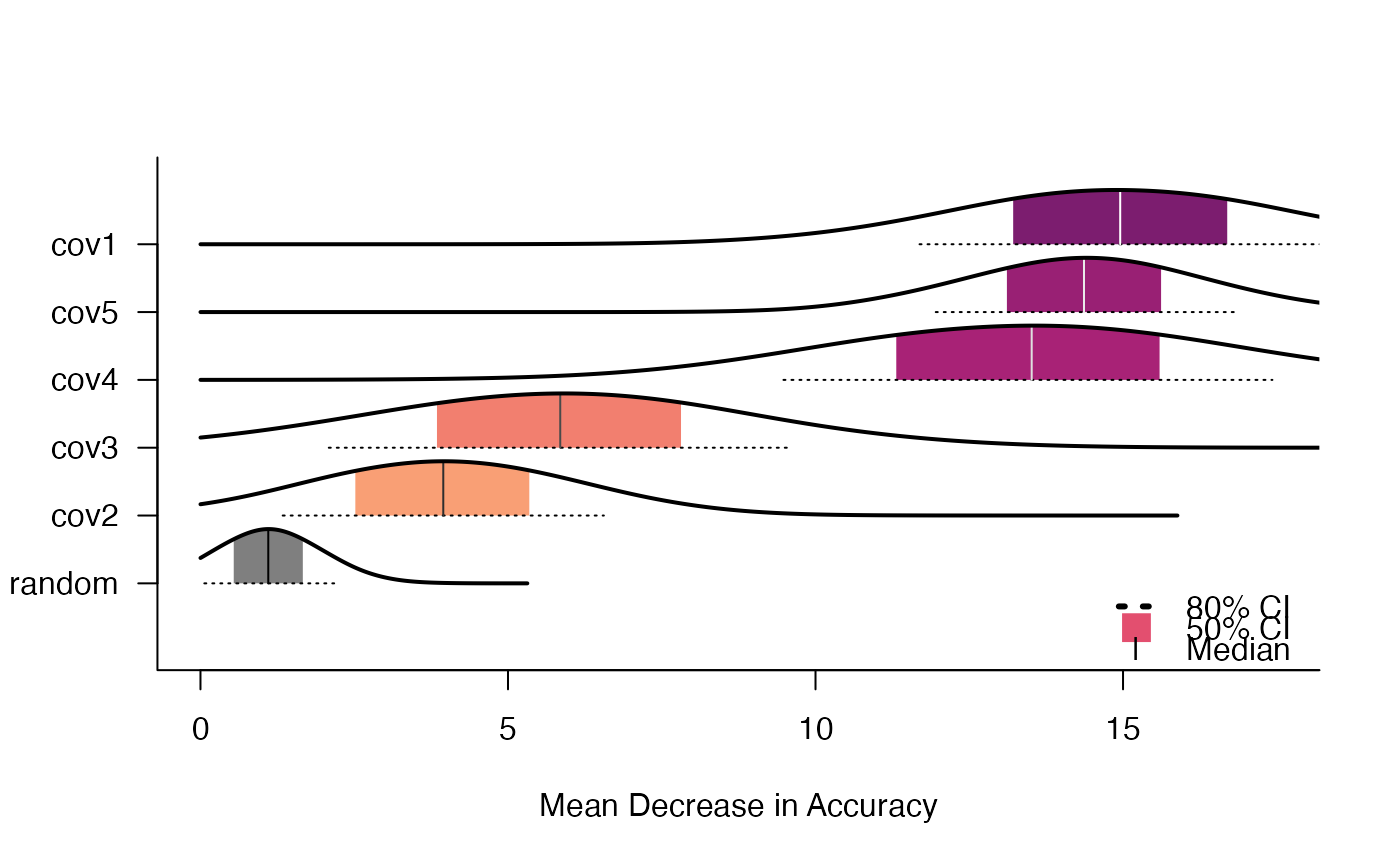
Plots the variable importance from the Ensemble Random Forests model
erf_impt(fit, var.names, pal)Arguments
- fit
The fitted object returned from calling ens_random_forests()
Value
A plot of the variable importance distributions ordered by the mean variable importance.
Examples
#run an ERF with 10 RFs and
ens_rf_ex <- ens_random_forests(df=simData$samples, var="obs", covariates=grep("cov", colnames(simData$samples),value=T), save=FALSE, cores=1)
#> rounding n.forests to the nearest one

erf_impt(ens_rf_ex)
